Poster
Executive Summary:
Stablecoins are designed to maintain a tight peg to a target asset, typically the U.S. dollar. However, deviations (“de-pegs”) occur in practice and can propagate systemic risk throughout crypto markets. This study investigates whether de-peg events can be predicted using a combination of trade volume and Google Trends search volume. We develop and test three anomaly-based detection methods, Interquartile Range (IQR), Z-Score, and Median Absolute Deviation (MAD), alongside a supervised machine-learning model, Random Forest. De-peg events are categorized into Type 1 (mild deviation: ≥1% but <20% from $1) and Type 2 (severe deviation: ≥20%). Using a dataset of 33 CSV files containing historical de-pegs, we perform repeated random file-level train–test splits (11 training, 22 testing) for 5 iterations. For the anomaly detection models, parameters such as rolling-window length and model threshold are tuned via grid search. For the random forest model, parameters including tree depth and estimators are optimized.
Across all anomaly detection methods, performance varied depending on de-peg severity, with Z-Score and IQR generally outperforming MAD for Type 1 detection, while MAD showed strong robustness for Type 2 de-pegs. Random Forest models achieved high in-sample accuracy but only moderate cross-file generalization. A major constraint throughout the study is the limited availability of long-span, fully continuous historical hourly data for both trade and search volumes, which restricts the granularity of temporal modeling and may underrepresent short-lived deviations. Overall, the results suggest that combining search-volume behavior with market signals significantly improves de-peg detection, but generalization to unseen events remains difficult due to data sparsity, limited availability of historical hourly data, and the substantial heterogeneity of stablecoin de-pegs. Importantly, across all anomaly detection methods and the Random Forest model, Type 2 de-pegs proved consistently easier to predict than Type 1 de-pegs, indicating that extreme instability produces clearer and more detectable precursors than subtle early-stage deviations.
Research Motivation:
Stablecoins are widely used for trading, payments, and lending in digital finance, with cumulative trade volumes exceeding tens of trillions of dollars in recent years (McKinsey & Company, 2023). Despite their intended stability, stablecoins can deviate from their peg, which propagates systemic risk across cryptocurrency markets.
Few papers provide a framework for stablecoin de-peg prediction with only one paper currently incorporating search volumes as a part of a de-peg prediction framework. Cintra & Holloway (2023) do not incorporate any search volume or sentiment-based indicators in their analysis, whereas Lee et al. (2024) employ data from AlternativeMe and AlphaDataAnalytics. Lee et al. (2024) report that incorporating sentiment indicators does not significantly improve predictions, a finding that aligns with the present study for Type 1 de-pegs. However, for Type 2 de-pegs, results from the present paper suggest that such indicators can provide meaningful predictive value. While Lee et al. utilize generalized sentiment indexes, including a Bitcoin focused index from AlternativeMe and an indicator on “crypto” from AlphaDataAnalytics, this study focuses on coin-specific search behavior derived from Google Trends, allowing for a more targeted assessment of public attention and concern related to individual stablecoins.
Research Objective:
This study aims to develop an anomaly detection framework to predict stablecoin de-pegs and classify their severity (Type 1 or Type 2) by adaptively combining behavioral indicators (Google Trends search volumes of relevant keywords) and market indicators (trade volume) through weighted integration.
Research Methodology:
For the anomaly detection methods, grid search was used to explored both the rolling window size (3 or 7 days) and the method-specific parameter (k for IQR/MAD or z for Z-Score) to determine the combination that maximized detection performance. Metrics were computed using a rolling window, allowing the model to capture short-term dynamic. To robustly evaluate performance, we employed a 5-elbow test-train split, randomly dividing the dataset of 33 stablecoins 5 times: each split trained on 11 datasets and tested on the remaining 22. The same procedure was applied to Random Forest, where the number of trees and maximum depth were tuned within each rolling window and evaluated across all splits, allowing comparison between anomaly detection methods and machine learning-based approaches under consistent test conditions.
Results:
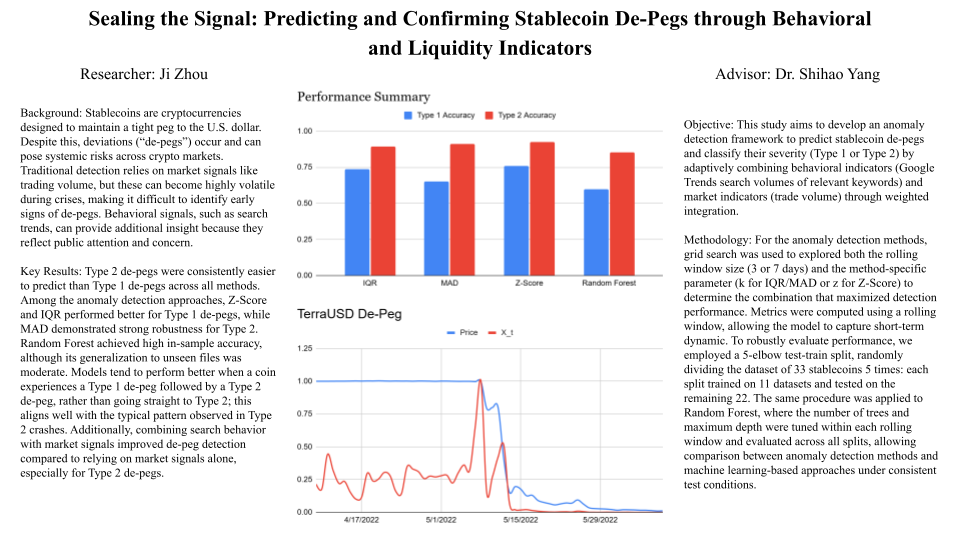
De-pegging events are categorized as Type 1, representing mild deviations from the peg (≥1% but <20% from $1), and Type 2, representing severe deviations (≥20% from $1). Among the three anomaly detection methods, the Z-Score approach achieved the highest accuracy for both Type 1 and Type 2 de-pegs, with 0.758 and 0.924, respectively. The Interquartile Range (IQR) method performed slightly lower, with 0.736 for Type 1 and 0.894 for Type 2, while the Median Absolute Deviation (MAD) method reached 0.650 for Type 1 and 0.911 for Type 2. The Random Forest classifier achieved 0.598 accuracy for Type 1 de-pegs and 0.854 for Type 2.
Accuracy for each de-peg type is calculated as the proportion of correctly identified events out of all events of that type in the test set. Specifically, Type 1 accuracy is the number of mild de-pegs correctly predicted divided by the total number of mild deviations (≥1% but <20% from $1), and Type 2 accuracy is the number of severe de-pegs correctly predicted divided by the total number of severe deviations (≥20% from $1).
Conclusions and Future Work:
Overall, the results indicate that extreme de-pegs are consistently easier to detect than mild deviations across all methods, reflecting the stronger signal associated with pronounced market disruptions. Future research could benefit from incorporating a Markovian approach to better capture the sequential dynamics of stablecoin de-pegs, modeling transitions between states such as Type 1 and Type 2 de-pegs. Care must be taken to avoid the curse of dimensionality, as the number of states and parameters could grow quickly with more detailed market features. Additionally, evaluating this framework on higher-frequency data, such as hourly price and market signals, could provide more timely detection and improve predictive performance, should such data become available. Extending the methodology in these directions would enhance both the granularity and robustness of this framework.