Executive Summary:
Operating room (OR) scheduling in pediatric hospitals is challenging due to the high variability in surgery durations and the high cost of OR time. Even a small prediction error can lead to significant inefficiencies: overestimation of case length leads to idle OR time, while underestimation causes delays and overtime. This research addresses the problem by developing a data-driven model to predict pediatric surgery durations more accurately than the current scheduling estimates. We compiled a comprehensive dataset of pediatric surgical cases from a children’s hospital, including numerous features related to the patient, procedure, surgical team, timing, and historical case durations. We then applied and compared multiple modeling approaches, ranging from simple linear regression to advanced machine learning algorithms such as ensemble decision trees.
Our results show that machine learning can substantially improve prediction accuracy for pediatric surgery times. In particular, a Light Gradient Boosting Machine (LightGBM) model achieved the best performance, significantly outperforming the hospital’s current Scheduled Duration estimates. The LightGBM model reduced both absolute error (in minutes) and relative error (percentage deviation) compared to the existing scheduling predictions. For example, the baseline scheduling estimates had a root-mean-square error (RMSE) on the order of tens of minutes (approximately 50 minutes) and a mean absolute percentage error (MAPE) over 40%. The LightGBM model was able to reduce these errors by a substantial margin (on the order of 20% improvement in RMSE and a reduction of MAPE into the 30% range), indicating a far more reliable prediction of surgery length.
Notably, the model’s improved accuracy can translate to better operational outcomes. More precise duration predictions enable more efficient OR scheduling – surgeons and staff can be scheduled with less downtime between cases, and the risk of overruns and delays is minimized. This means potential cost savings (given an estimated $62 per OR minute) and improved patient flow. The study also provided insights into which factors most influence pediatric surgery durations (such as historical case duration, surgical team experience, and patient characteristics), knowledge that can inform future scheduling and process improvements. In summary, this research demonstrates a successful application of machine learning to optimize pediatric surgical scheduling, with the LightGBM model offering a practical tool for predicting case durations and thereby improving operating room utilization and reducing costs.
Research Motivation:
Efficient management of operating rooms is a critical concern for hospitals, especially in high-demand specialties like pediatric surgery. The motivation for this research stems from two main challenges: the unpredictability of pediatric surgery lengths and the high cost associated with this uncertainty. Studies have shown that pediatric surgical case durations can vary widely even for similar procedures
Such variability arises from numerous factors – patient condition, case complexity, surgical team differences, and unforeseen complications – making accurate estimation difficult. Yet, accurate estimates are vitally important: each minute of OR time costs around $62 on average. Thus, even modest scheduling inaccuracies can translate into significant financial cost and resource waste.
In current practice, hospitals often rely on simplistic methods or clinician estimates to schedule surgeries. For example, a common approach is to use historical average durations for a given procedure type or to defer to a surgeon’s or anesthesiologist’s prediction of how long the case will take. However, these methods do not account for patient-specific or context-specific factors and often fail to capture the true variability in case duration
In pediatric cases, the challenge is pronounced: children’s physiology and surgical complexity can vary dramatically, and teaching hospitals frequently involve rotating teams which can affect efficiency. Inaccurate case duration estimates can lead to two major issues in OR operations:
- Excess Idle Time or Underutilization: If a surgery is scheduled with a duration longer than what actually occurs (a common practice to build in buffer time), the OR may sit idle until the next case. This underutilization means lost opportunity to treat additional patients and wasted staffing resources.
- Delays and Overtime: Conversely, if a surgery runs longer than expected (underestimation), it can cascade delays to all subsequent cases scheduled that day. This results in surgeons and staff working overtime, increased patient wait times (including prolonged fasting for pediatric patients), and potential crowding or backup in pre-operative and recovery areas. Such delays can cause stress for families and fatigue for medical staff, potentially increasing the risk of errors.
These problems highlight why more accurate prediction of surgery durations is important. By improving estimation accuracy, a hospital can optimize its scheduling to reduce gaps and overruns, leading to better utilization of expensive OR time, cost savings, and improved patient and provider satisfaction. In the context of a children’s health system, better scheduling means more children can receive timely surgery and clinicians can adhere more closely to planned schedules. This motivation drove our research to explore advanced predictive modeling for pediatric surgery durations, moving beyond simple averages or subjective guesses to a data-driven approach that can handle the complexity and variability inherent to these cases.
Research Objective:
The primary objective of this research is to develop and evaluate a predictive model for pediatric surgery case duration (from “wheels-in” to “wheels-out” of the operating room). We aim to create a model that can forecast the length of a surgical procedure more accurately than the current scheduling method, thus providing a better foundation for planning and optimizing the daily surgical schedule. In pursuit of this goal, several specific sub-objectives were defined:
- Identify Key Predictors: Determine which factors (patient characteristics, procedure details, provider/team information, etc.) are most relevant to predicting how long a surgery will take. Pediatric surgeries involve many potential variables – from the patient’s age and health status to the surgeon’s experience level – so part of our objective is to discover which of these variables have significant predictive power for case duration. By identifying these, we also gain clinical and operational insights into what drives longer or shorter surgeries.
- Compare Prediction Models: Apply a range of predictive modeling approaches and compare their performance in forecasting surgery duration. We considered models across the spectrum of complexity – from interpretable linear models to more complex machine learning algorithms – to assess the trade-offs in accuracy and interpretability. The objective was not only to find the most accurate model, but also to understand how much benefit more complex models provide over simpler ones, and at what cost in terms of transparency or ease of use. This includes analyzing the trade-off between model performance and interpretability, which is important in a healthcare setting where trust and understanding of a model’s predictions by clinicians can be as important as raw accuracy.
- Develop a Practical Tool for Scheduling: Ultimately, the end goal is to improve operating room scheduling efficiency. While our study’s scope focuses on the predictive aspect (i.e. estimating surgery durations), the long-term vision is to integrate this predictive model into the scheduling process. By doing so, surgical cases can be allocated to operating rooms and time slots with more realistic duration estimates, helping planners sequence surgeries and assign resources in a way that minimizes downtime and delays. Thus, our objective includes validating that the model’s predictions are robust and reliable enough to be used in practice and discussing how they could be utilized in an optimization or scheduling system. We also seek to provide recommendations on how the improved duration predictions might be employed by schedulers, for example in deciding case order or when to start cases, to achieve smoother daily OR operations.
In summary, the research objective is to build a robust predictive model for pediatric surgery durations, understand the important factors influencing those durations, achieve improved accuracy over existing methods, and lay the groundwork for using these predictions to enhance surgical scheduling and resource allocation at children’s hospitals.
Research Methodology:
To address the objectives, we followed a structured methodology consisting of data collection and preprocessing, feature engineering, model development, and evaluation/analysis:
Data Collection and Overview: We obtained a retrospective dataset of pediatric surgical cases from Children’s Health (a major pediatric hospital). Each record in the dataset corresponds to a single surgery and includes detailed information that we used as predictor variables for duration. The data covered a broad range of surgeries across different specialties, providing a diverse sample of case lengths. For each surgical case, we extracted features in several categories:
- Patient Information: Basic demographics and health indicators of the patient. This included the patient’s age (in years), sex, and a classification of the patient’s status or acuity. We also had clinical details such as the patient’s ASA (American Society of Anesthesiologists) physical status rating, which ranges from 1 (healthy) to 5 (severely ill) and indicates anesthesia risk and indirectly complexity. Vital signs like preoperative systolic and diastolic blood pressure were included as well, as they can reflect patient condition (for example, very high or low blood pressure might indicate a more complex case or a stressed patient). We also noted patient’s body metrics (e.g., BMI) if available, and the payor type (insurance type) as a proxy for socio-demographic factors.
- Procedure Details: Information about the surgery itself, such as the surgical specialty/service (e.g., general surgery, cardiology, orthopedics, etc.) and the specific case type or procedure category. These are important because different procedures naturally have different typical durations. We also considered whether the case was the first case of the day for that operating room (first-case status) which can be relevant as first cases have no preceding delays but also can be delayed by morning setup processes. A crucial engineered feature in this category was the moving average of past durations for similar cases: for each surgery, we computed the average actual duration of the last 3 cases of the same type (and within the same specialty) – termed Elapsed Duration MA3. This feature provides a data-driven prior expectation for the case length based on recent history, and we hypothesized it would be a strong predictor.
- Scheduling and Timing Variables: We included temporal features such as whether the surgery started in the morning or afternoon (AM/PM), the day of week, week of the month, month, and whether the date was a holiday. These capture potential patterns like weekly scheduling differences or seasonal effects (for instance, certain elective pediatric surgeries might cluster at certain times of year, or staffing levels might differ on weekends vs weekdays, affecting throughput).
- Surgical Team & Provider Factors: We gathered information about the surgeon and the OR team for each case. This included the identity of the primary surgeon (anonymized ID) and the surgeon’s experience (e.g., years of practice or number of past cases performed). Team familiarity measures were also derived – for example, we calculated how frequently the same team members (surgeon, anesthesiologist, nurses) had worked together in the past, measured in terms of number of prior shared cases or cumulative minutes together as a team. The intuition is that a well-coordinated team that has worked together often may perform surgeries more efficiently. Another related feature was room familiarity – whether the surgeon (or team) was very accustomed to the specific operating room environment. We also tracked if the surgery had any preceding delays: how many cases in the same room earlier that day were delayed and the total minutes of delay before this case’s start. This feature captures the ripple effect of schedule delays (e.g., if previous surgeries ran late, the team might be either warmed-up and quick, or the schedule disruption might carry into the next case).
- Outcome Variable: The target we aimed to predict was the actual surgery duration, measured from patient entry to exit of the operating room (in minutes). This is sometimes called “wheels-in to wheels-out” time. All predictor features listed above were available prior to the surgery start (either known in advance or easily obtainable at scheduling time), making them suitable for forecasting the duration.
Data Preprocessing: Before modeling, we cleaned and prepared the dataset. We handled missing values in features (for instance, if any vital sign or ASA rating was occasionally not recorded, we employed appropriate imputation or omitted those cases as necessary). Categorical variables like surgical service, day of week, or surgeon ID were encoded for use in models (either via one-hot encoding or ordinal encoding, depending on the model). We also normalized or scaled continuous variables such as age or blood pressure where needed, especially for models sensitive to feature scale (e.g., linear regression or SVM). Outlier analysis was performed on the duration variable – extremely long or short cases relative to their peers were examined to decide if they were special-case scenarios (such as multi-stage procedures or aborted surgeries) that should be excluded to prevent skewing the model training. Additionally, we computed the engineered features mentioned (moving averages, familiarity metrics) from the raw data, merging those into the dataset. The dataset was then split into training and testing sets (for example, using an 80/20 split stratified by surgical specialty to ensure representation across all types in both sets). We also considered time-based splits (training on earlier years, testing on later data) to mimic prospective prediction, ensuring that the model was evaluated on data it had not seen.
Model Development: We evaluated a suite of prediction models, each bringing different advantages, to determine which would be most suitable for our problem. The models we considered include:
- Linear Regression: A multivariate linear model that creates a weighted sum of all features to predict duration. This model is fast to train and easily interpretable (coefficients indicate the direction and magnitude of each feature’s impact on duration), but it can only capture linear relationships and may perform poorly if the true relationships are complex or interactive.
- Decision Tree Regression: A binary decision tree that splits the data based on feature values to predict duration. This model can capture non-linear relationships and interactions in the data (by splitting on different features sequentially). It’s relatively interpretable (one can follow the tree structure to see how predictions are made) and handles categorical variables well. However, single decision trees can be unstable and prone to overfitting, especially if not pruned, and they may not be as accurate as ensemble methods.
- Random Forest: An ensemble of many decision trees (trained on bootstrapped samples of the data with random feature selection for splits) whose predictions are averaged. Random forests improve over single trees by reducing variance and are generally more robust and accurate. They can handle complex feature interactions and are less sensitive to outliers or noise. While more complex than a single tree, they retain some interpretability through measures like feature importance (though not as straightforward as linear models). Random forests tend to be slower to train/predict than a single tree but still feasible for our dataset size.
- Support Vector Regression (SVR): A support vector machine applied to regression. We considered SVR with non-linear kernels (like RBF) to potentially capture intricate relationships in the data. SVR tries to find a function that fits the data within a certain error margin, maximizing margin around the hyperplane. It can handle high dimensional data and complex relations, but it typically requires careful parameter tuning (kernel parameters, regularization) and can be computationally intensive on larger datasets. SVR is less interpretable, as the resulting model is not easily expressed in terms of the original features.
- Light Gradient Boosting Machine (LightGBM): A gradient boosting framework using tree-based learners, known for its efficiency and high performance. LightGBM builds an ensemble of decision trees in a stage-wise fashion, where each new tree corrects errors of the combined existing model. It can handle large datasets and many features, capturing non-linear effects and interactions automatically. LightGBM also has built-in mechanisms to reduce overfitting (through regularization and early stopping) and often achieves better accuracy than random forests by focusing on difficult-to-predict cases with each new tree. The trade-off is reduced interpretability – while feature importance can be extracted, the overall model is a black box in terms of how it combines features to make a prediction.
For all models, we used the same training data and features to ensure a fair comparison. We performed hyperparameter tuning for the more complex models (Random Forest, SVR, LightGBM) using cross-validation on the training set. For example, we tuned the number of trees and maximum depth for Random Forest, the kernel parameters and regularization for SVR, and the learning rate, tree depth, and number of boosting rounds for LightGBM. We applied 5-fold cross-validation to prevent overfitting during this tuning process – meaning the training data was further split into folds where the model was trained on 4 folds and validated on the 5th, rotating this process, to find parameters that generalize well. The simplest models (Linear Regression, an un-pruned Decision Tree) were also tested, with regularization added to linear regression if needed (ridge regression) to handle multicollinearity.
Performance Evaluation:
We evaluated model performance on the reserved test dataset (and also tracked cross-validation performance to ensure consistency). The primary evaluation metrics were Root Mean Squared Error (RMSE) in minutes, which heavily penalizes larger errors, and Mean Absolute Percentage Error (MAPE), which expresses error as a percentage of the actual duration, useful for understanding error relative to case length. These metrics were chosen to capture both absolute and relative accuracy of predictions. Additionally, we looked at Mean Absolute Error (MAE) for a more direct interpretation of average error in minutes, and we examined the distribution of prediction errors (error = predicted – actual) to see if models tended to over- or under-predict systematically.
We also compared all models against the hospital’s current scheduling Scheduled Duration predictions. The Scheduled Duration for each case is essentially the duration that was initially allocated on the schedule (the hospital’s best guess, based on their existing process). This serves as a baseline model – effectively how things are done now without our predictive model. Any improvement of our models over the Scheduled Duration in accuracy would demonstrate the value of the data-driven approach.
Interpretability and Analysis:
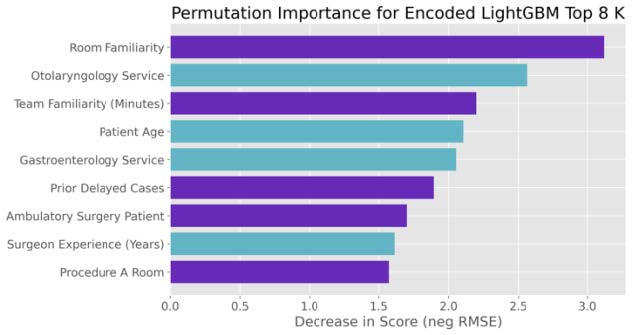
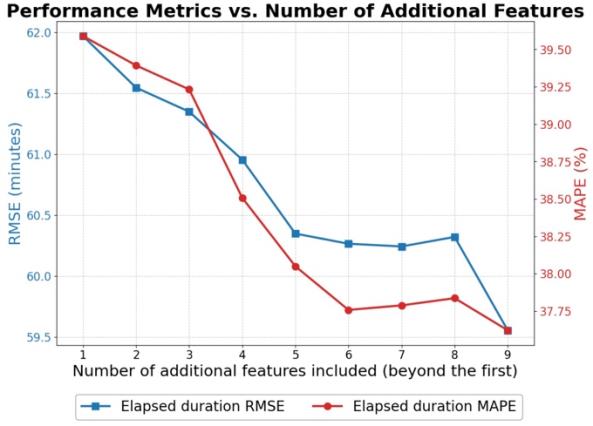
Given the importance of interpretability in healthcare, we devoted effort to interpreting the best-performing model. For the LightGBM model, we extracted feature importance rankings (e.g., based on gain or permutation importance) to identify which features contributed most to reducing prediction error. We also employed partial dependence plots for the top features to visualize how changes in a feature affect the predicted duration, holding other factors constant. This analysis helps verify that the model’s behavior is clinically reasonable (for instance, seeing that predicted duration increases for higher ASA ratings or for less experienced surgeons aligns with expectation). We also analyzed the effect of using different numbers of top features. By progressively building models with the most important features, we observed how performance changed, noting that beyond the top ~7 features, additional variables yielded diminishing returns in accuracy. This suggests a possible simplified model or at least highlights that a core subset of features carries most of the predictive signal.
In summary, our methodology combined a rich dataset with thoughtful feature engineering and a range of modeling techniques, followed by rigorous evaluation. This approach enabled us to not only find the best model for predicting pediatric surgery durations but also to understand why it performs well and how it could be implemented in practice.
Results:
Our LightGBM model substantially outperformed the hospital’s current scheduling estimates. While the baseline Scheduled Duration had an RMSE of ~50 min and MAPE of ~42 %, LightGBM reduced RMSE by ~20–30 % (to ~35–40 min) and MAPE into the low-30 % range. Ensemble methods (Random Forest, SVR) also improved over baseline but fell slightly short of LightGBM. Error‐distribution analysis showed that scheduling estimates systematically overestimate durations, whereas LightGBM’s errors were centered near zero with a tighter spread, indicating fewer extreme underruns or overruns.
Feature‐importance analysis revealed that the top predictors were:
- Historical average duration (Elapsed Duration MA3)
- Procedure type/specialty
- Surgeon experience
- Team familiarity
- Patient age and physiological indicators
Beyond the first ~7 features, additional variables yielded diminishing returns, suggesting these core factors capture most of the predictive signal.
Conclusions and Future Work:
We demonstrated that a LightGBM model can predict pediatric surgery durations more accurately than current scheduling methods, cutting absolute and relative errors by roughly 20–30 %. Key drivers—recent case history, team experience, and patient factors—offer actionable insights for scheduling practices.
Future directions include:
- Integrating the model into live scheduling tools and conducting a pilot for prospective validation.
- Developing an optimization module that uses these predictions to sequence cases and assign rooms.
- Exploring adaptive, real-time updates to adjust schedules mid-day.
- Periodically retraining the model on new data to maintain accuracy.
These steps will help translate our findings into operational gains: better OR utilization, reduced overtime, and improved patient flow.